
Öz
Objective: Thyroid hormones play a role in metabolic regulation, yet their associations with obesity and insulin resistance in euthyroid individuals remain unclear. This study aimed to evaluate the relationship between thyroid-stimulating hormone (TSH), fT3, fT4, and the fT3/fT4 ratio with metabolic parameters in euthyroid women.
Methods: In this retrospective cross-sectional study, 236 euthyroid women aged 18–65 were recruited from a tertiary hospital in Istanbul between May and September 2023. Participants were categorized as individuals with normal weight, overweight, or obesity. Thyroid hormones and metabolic parameters (waist circumference, triglycerides, HDL-C, insulin resistance) were analyzed. Statistical analyses included correlation tests and ANCOVA for age adjustment.
Results: No significant differences in thyroid hormone levels were found across BMI groups after adjusting for age. TSH was positively correlated with BMI and triglyceride levels. fT3 and the fT3/fT4 ratio were positively associated with insulin resistance and negatively associated with HDL-C.
Conclusion: fT3 and the fT3/fT4 ratio may reflect metabolic alterations in euthyroid individuals. These findings highlight the potential relevance of thyroid hormone evaluation in assessing metabolic risk, especially among individuals with obesity or insulin resistance. Further multicenter studies are warranted.
Anahtar Kelimeler: thyroid hormones, insulin resistance, obesity, metabolic syndrome
Introduction
Thyroid hormones regulate metabolic rate and oxygen consumption. They also influence protein synthesis and catabolism. They facilitate intestinal glucose absorption and hepatic gluconeogenesis. They also promote lipolysis and increase circulating free fatty acids. Thyroid hormones also influence lipid metabolism, contributing to lower cholesterol levels in the blood. Proper thyroid function is crucial for metabolic balance and healthy body composition. They influence metabolic processes relevant to growth, energy expenditure, and nutrient regulation.[1]
The impact of these hormones on metabolic parameters is primarily characterized by their role in regulating energy homeostasis, lipid metabolism, and gluconeogenesis, which influence overall body metabolism.[2] Key metabolic parameters influenced by thyroid hormones include insulin resistance, abdominal obesity, waist circumference, and dyslipidemia.[3] Early detection and prevention of insulin resistance have been effective in reducing the risk of cardiometabolic diseases. However, there is conflicting evidence regarding the relationship between normal-range thyroid hormone levels and insulin resistance.[4]
Obesity is defined as a chronic metabolic condition characterized by excessive fat accumulation in the body, often accompanied by insulin resistance. This condition affects multiple systems, particularly the cardiovascular and endocrine systems, and poses significant health risks.[5] In recent years, the relationship between thyroid hormones and obesity has been widely discussed. The effect of normal-range thyroid hormone levels on body weight and metabolic risk parameters remains unclear.[6]
The objective of this study is to conduct a retrospective investigation to determine whether thyroid hormones (Thyroid-stimulating hormone (TSH), fT3, fT4) and the fT3/fT4 ratio are associated with obesity, insulin resistance, and other metabolic parameters (waist circumference, triglyceride, High-density lipoprotein- cholesterol (HDL-C)) in euthyroid women. This study focused exclusively on women to control for the potential confounding effects of sex on thyroid hormone regulation and metabolic responses. Previous researches has demonstrated that hormonal variations between men and women significantly influence fat distribution, insulin sensitivity, and overall metabolic homeostasis.[7,8] Therefore, limiting the sample to euthyroid women allowed for a more homogeneous population and improved the internal validity of our findings.
We hypothesize that thyroid hormone parameters within the normal range are significantly associated with insulin resistance and metabolic alterations in euthyroid women. Clarifying these associations in euthyroid women could contribute to early identification of metabolic risks in primary care settings.
Material and Methods
This retrospective, cross-sectional study was conducted at the family medicine and obesity outpatient clinics of a tertiary hospital in Istanbul between May and September 2023.
Population
A priori power analysis was performed using G*Power version 3.1.9.7 to estimate the minimum required sample size. Based on a level of 0.05, statistical power of 0.95, and a medium effect size (f=0.25), the analysis indicated that at least 159 participants were needed. The final sample of 236 women exceeded this requirement, ensuring adequate statistical power for the analyses.
Female patients aged 18–65 who visited the outpatient clinics during the study period were screened for eligibility. Data were collected by reviewing patient files and electronic health records. Participants were included consecutively based on their fulfillment of inclusion criteria and absence of any exclusion criteria. No random sampling method was applied. Out of 281 initially eligible women, 45 were excluded due to incomplete data, yielding a final sample size of 236 participants. Exclusion criteria included: Male sex, Age <18 year, Pregnancy or lactation, History of thyroid disease/diabetes/cardiovascular disease/cancer/renal failure, Use of medications affecting thyroid function (e.g., amiodarone, steroids, lithium), Thyroid hormone levels outside the reference range.
Study variables
Participants were classified into three BMI categories: normal weight (18.5–24.9 kg/m²), overweight (25.0–29.9 kg/m²), and obesity (≥30 kg/m²). Serum levels of TSH, fT3, fT4, and the calculated fT3/fT4 ratio were compared across BMI categories. Metabolic parameters included waist circumference, triglycerides, HDL-C, and insulin resistance, assessed via the Homeostasis Model Assessment of Insulin Resistance (HOMA-IR) index. HOMA-IR was calculated using the formula: (fasting glucose × fasting insulin) / 405.
Ethical approval
The Declaration of Helsinki was followed in the planning and execution of this study. The study was approved by the İstanbul Medeniyet University Göztepe Training and Research Hospital Clinical Research Ethics Committee on 27.09.2023 (decision no: 2023/0637).
Data analyses
All statistical analyses were conducted using IBM SPSS Statistics for Windows, Version 25.0 (IBM Corp., Armonk, NY, USA). Descriptive statistics included frequency (%), mean ± standard deviation, and median (min–max) values. Normality was assessed via the Shapiro-Wilk and Kolmogorov-Smirnov tests. Normality was assessed via the Shapiro-Wilk and Kolmogorov-Smirnov tests. Parametric tests: Student’s t-test, One-way ANOVA, Bonferroni post-hoc. Non-parametric tests: Mann-Whitney U, Kruskal-Wallis, Dunn post-hoc. Covariate adjustment was done using ANCOVA for age. Correlations were evaluated using Pearson or Spearman coefficients depending on data distribution. Categorical variables were compared using the Chi-square test. Statistical significance was defined as p<0.05.
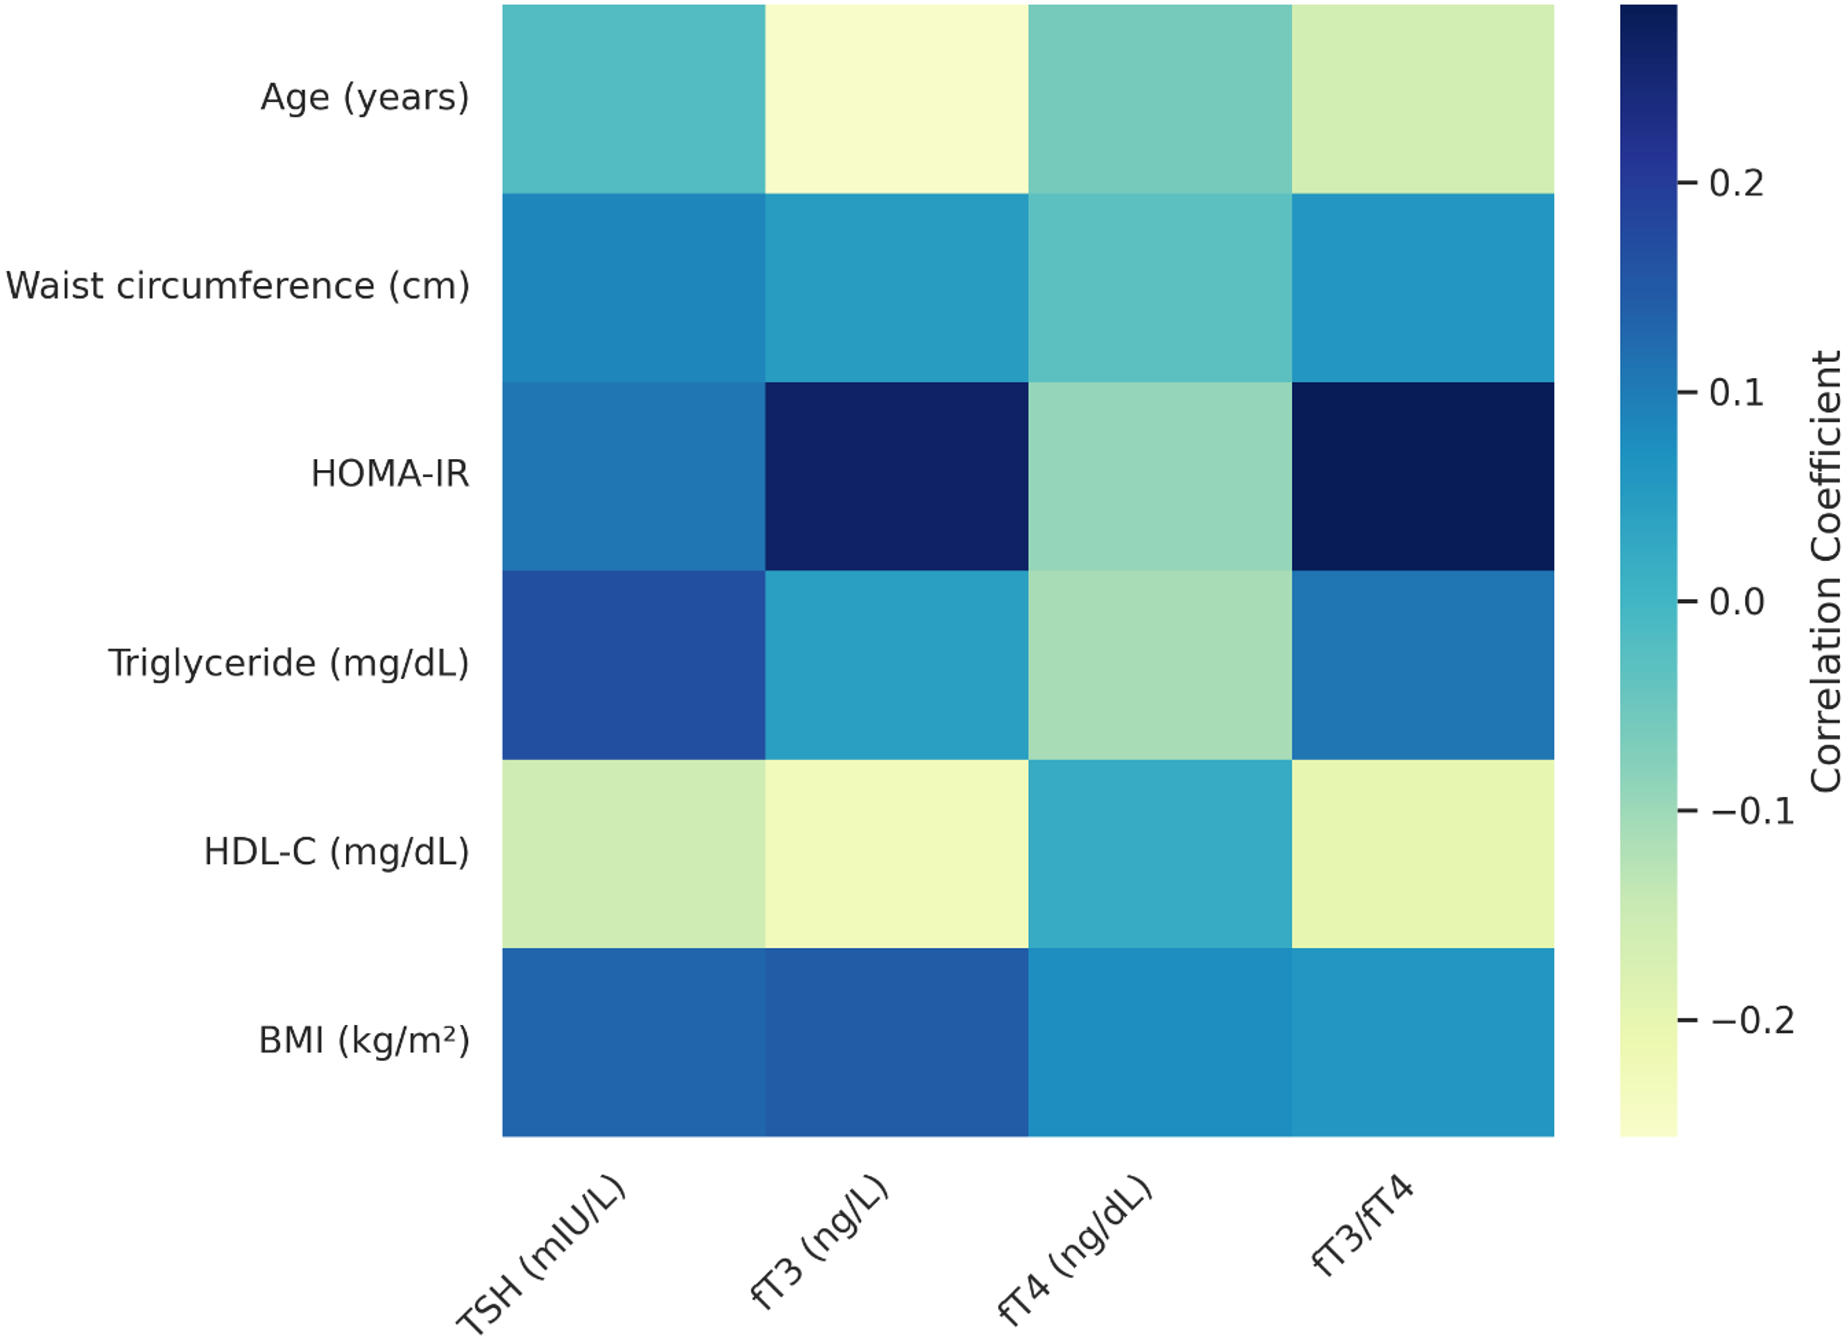
To visually summarize the correlations between thyroid hormone levels and metabolic parameters, a heatmap was generated based on the correlation coefficients obtained in this study. This visual was created using ChatGPT (OpenAI) for graphical assistance.
Results
The present study was conducted with 236 women under follow-up and treatment in the Obesity and Family Medicine outpatient clinics between May 2023 and September 2023.
Descriptive characteristics
Table 1 presents the descriptive characteristics of the study participants. The study included 236 women aged 18–64 years (mean: 32.9±7.8). The mean BMI was 32.9±7.8 kg/m² (range: 18.5–55.8). The data revealed that 67.4% (n=159) had obesity, 16.9% (n=40) were overweight, and 15.7% (n=37) had a normal weight. The average waist circumference was 101.1±17.1 cm, with values ranging from 62 to 154 cm. Of the study participants, 27.5% (n=65) had various chronic diseases, and 41.1% (n=97) had insulin resistance.
| SD: Standard Deviation; BMI: Body Mass Index. | ||
| Table 1. Descriptives of the participants | ||
| Variables | Groups | n (%) |
| Gender | Female | 236 (100.0) |
| Age (years) | Mean ± SD | 43.1±13.4 |
| Median (Min-Max) | 46 (18-64) | |
| BMI (kg/m2) | Mean ± SD | 32.9±7.8 |
| Median (Min-Max) | 32.5 (18.5-55.8) | |
| Have Obesity | 159 (67.4) | |
| Overweight | 40 (16.9) | |
| Normal | 37 (15.7) | |
| Waist circumference (cm) | Mean ± SD | 101.1±17.1 |
| Median (Min-Max) | 102 (62-154) | |
| Insulin resistance | No | 139 (58.9) |
| Yes | 97 (41.1) | |
| Other chronic diseases | No | 171 (72.5) |
| Yes | 65 (27.5) | |
Group comparisons
As shown in Table 2, age significantly differed across BMI groups, with normal-weight participants being younger than overweight and individuals with obesity (p=0.001).
|
aKruskal Wallis Test; bOne-way ANOVA Test; cPearson Chi-Square Test. *p<0.05; **p<0.01. SD: Standard Deviation; HDL-C: High Density Lipoprotein-Cholesterol; TSH: Thyroid Stimulating Hormone; HOMA-IR: Homeostatic Model Assessment for Insulin Resistance. |
|||||
| Table 2. Comparison analyses by groups | |||||
| Variables |
|
|
|||
|
(n=159) |
|
(n=37) |
|||
| Age (years) | Mean ± SD |
|
|
|
|
| Median (Min-Max) |
|
|
|
||
| Waist circumference (cm) | Mean ± SD |
|
|
|
|
| Median (Min-Max) |
|
|
|
||
| HDL-C (mg/dL) | Mean ± SD |
|
|
|
|
| Median (Min-Max) |
|
|
|
||
| Triglyceride (mg/dL) | Mean ± SD |
|
|
|
|
| Median (Min-Max) |
|
|
|
||
| Insulin (mU/L) | Mean ± SD |
|
|
|
|
| Median (Min-Max) |
|
|
|
||
| TSH (mIU/L) | Mean ± SD |
|
|
|
|
| Median (Min-Max) |
|
|
|
||
| fT3 (ng/L) |
Mean ± SD |
|
|
|
|
| Median (Min-Max) |
|
|
|
||
| fT4 (ng/dL) |
Mean ± SD |
|
|
|
|
| Median (Min-Max) |
|
|
|
||
| fT3/fT4 | Mean ± SD |
|
|
|
|
| Median (Min-Max) |
|
|
|
||
| HOMA-IR | Mean ± SD |
|
|
|
|
| Median (Min-Max) |
|
|
|
||
| Insulin resistance | No |
|
|
|
|
| Yes |
|
|
|
||
| Other chronic diseases | No |
|
|
|
|
| Yes |
|
|
|
||
Waist circumference increased with BMI, and all pairwise comparisons were statistically significant (p=0.001). HDL-C levels were significantly lower in the group of obesity compared to normal-weight participants (p=0.001).
Triglyceride and insulin levels were also significantly higher in the obesity group compared to both overweight and normal-weight individuals (all p<0.05). Overweight participants had higher triglyceride and insulin levels than the normal-weight group (p=0.027 and p=0.025, respectively).
No significant differences were found among groups for TSH, fT3, fT4, or the fT3/fT4 ratio (p>0.05). HOMA-IR levels were highest in the obesity group (p=0.001), and insulin resistance was more prevalent in this group compared to normal-weight participants (p=0.049).
There were no significant differences in the prevalence of other chronic diseases between groups (p>0.05).
As seen in Table 3, when ANCOVA analysis was performed to eliminate the age difference between the groups, it was seen that the fT3 and fT3/fT4 ratio measurements of the cases according to the groups did not show any statistically significant difference (p>0.05).
| aANCOVA Test | |||
| Table 3. Evaluation of fT3 and fT3/fT4 ratio measurements according to groups when the age effect is eliminated | |||
|
|
|
||
| Obesity |
|
|
|
| Overweight |
|
|
|
| Normal |
|
|
|
|
|
|
|
|
A comparison of thyroid function parameters between individuals with and without insulin resistance revealed that fT3 levels (3.1±0.4 vs. 2.9±0.3 ng/L, p=0.001) and the fT3/fT4 ratio (2.7±0.4 vs. 2.5±0.3, p=0.001) were significantly higher in the insulin-resistant group. This finding suggests a link between elevated fT3 and metabolic imbalance. In contrast, TSH (p=0.446) and fT4 (p=0.323) demonstrated no significant differences between the groups. The statistical analyses encompassed the Student’s t-test for normally distributed variables (fT3, fT3/fT4) and the Mann-Whitney U test for non-normally distributed variables (TSH, fT4). The findings suggest that increased fT3 and fT3/fT4 ratio may be associated with insulin resistance, while TSH and fT4 remain unaffected.
Correlation analyses
The relationships between thyroid hormones and metabolic parameters are presented in Table 4. TSH levels showed weak but statistically significant positive correlations with triglyceride levels (r =0.167, p =0.010) and BMI (r =0.130, p =0.047). No significant associations were observed between TSH and HOMA-IR, age, or waist circumference (p>0.05).
|
†Pearson Correlation Coefficiency; ‡Spearman Correlation Coefficiency. *p<0.05; **p<0.01. TSH: Thyroid Stimulating Hormone; HOMA-IR: Homeostatic Model Assessment for Insulin Resistance; HDL-C: High Density Lipoprotein-Cholesterol; BMI: Body Mass Index. |
|||||
| Table 4. Correlation of thyroid hormones (TSH, fT3, fT4) and fT3/fT4 ratio with metabolic parameters | |||||
|
|
|
|
|
||
| Age (years) |
|
|
|
|
|
|
|
|
|
|
|
|
| Waist circumference (cm) |
|
|
|
|
|
|
|
|
|
|
|
|
| HOMA-IR |
|
|
|
|
|
|
|
|
|
|
|
|
| Triglyceride (mg/dL) |
|
|
|
|
|
|
|
|
|
|
|
|
| HDL-C (mg/dL) |
|
|
|
|
|
|
|
|
|
|
|
|
| BMI (kg/m2) |
|
|
|
|
|
|
|
|
|
|
|
|
fT3 levels were positively correlated with HOMA-IR (r =0.268, p =0.001) and BMI (r =0.145, p =0.026), and negatively correlated with HDL-C (r =–0.230, p =0.001) and age (r =–0.256, p=0.001). No significant relationships were found between fT3 and waist circumference or triglyceride levels (p>0.05).
fT4 showed no statistically significant correlations with any of the metabolic parameters, including waist circumference, HOMA-IR, BMI, triglycerides, or HDL-C (p>0.05).
The fT3/fT4 ratio was negatively associated with age (r=–0.162, p=0.001) and HDL-C (r=0.201, p=0.002), and positively associated with HOMA-IR (r=0.285, p=0.001). No significant associations were found between the fT3/fT4 ratio and BMI, waist circumference, or triglyceride levels (p>0.05). These correlations are visually presented in Figure 1, where the heatmap summarizes the relationships between thyroid parameters and metabolic indicators.
Discussion
Thyroid hormones play a significant role in regulating metabolic processes, and their potential influence on metabolic syndrome (MetS) and lipid metabolism has been widely investigated. In our study, we aimed to explore the relationship between thyroid hormone levels (TSH, fT3, fT4, and the fT3/fT4 ratio) and metabolic syndrome parameters such as waist circumference, lipid profile, and other markers. Below, we discuss the key findings in the context of existing literature.
TSH, fT3, fT4, and the fT3/fT4 ratio did not show a statistically significant relationship with waist circumference in our investigation. This finding contrasts with some earlier researches that found favorable correlations between waist circumference and abdominal obesity and TSH, fT3, and fT3/fT4 ratios. These discrepancies may be attributed to differences in study populations (e.g., general vs. clinical samples), sample sizes, age distributions, or sex ratios. Menopausal status, which influences both thyroid hormone levels and fat distribution, may also contribute to divergent findings. Furthermore, variations in assay methods, geographic and dietary iodine exposure, and inclusion/exclusion of subclinical thyroid disorders may influence outcomes. Therefore, our findings should be interpreted with caution, and future multicenter studies with stratified analyses are warranted.
Elevated upper-normal TSH levels were linked to a 1.9-fold increased risk of metabolic syndrome in postmenopausal women, according to Park et al.[9] Additionally, TSH levels and waist circumference were found to positively correlate by De Pergola et al., confirming the hypothesis that elevated TSH levels could lead to greater visceral fat formation.[10]
However, Roos et al. did not find a relationship between TSH and MetS risk in euthyroid individuals after adjustments for age and sex.[11] Similarly, Mehran et al. reported that no significant correlation existed between TSH levels and metabolic syndrome risk in euthyroid individuals.[12] These contradictory findings highlight the complexity of thyroid hormone regulation and its potential interaction with other metabolic factors.
Roos et al. also observed a negative correlation between fT4 and insulin resistance, along with other MetS components, after age and sex adjustments.[11] In contrast, Mehran et al. found a negative relationship between higher fT4 levels and triglycerides, hypertension, and waist circumference in euthyroid individuals.[12] Our study found no significant relationship between fT4 and triglycerides or HDL cholesterol levels. Kim et al. also did not observe a relationship between fT4 and MetS parameters in euthyroid individuals.[13]
Interestingly, Tarcin et al. reported a positive correlation between fT4 levels and MetS, which contradicts most studies suggesting a negative relationship between fT4 and these parameters. This suggests that fT4 may interact differently with MetS components depending on individual metabolic states.[14] Jin et al. confirmed that even within the normal range, thyroid hormones can have significant associations with MetS components, particularly emphasizing the role of fT4 in reducing T3 conversion and contributing to adverse metabolic profiles.[15]
These inconsistencies across studies may stem from methodological differences, including variations in study design (e.g., cross-sectional vs. longitudinal), population characteristics (e.g., age, BMI, menopausal status), sample sizes, and the presence or absence of confounding factor adjustments. Differences in laboratory assays and reference ranges may also influence the observed associations between fT4 and metabolic parameters.
De Pergola and Wolffenbuttel indicated that increased fT3 could be a compensatory mechanism in response to visceral fat accumulation, rather than a direct cause of obesity. Their findings point toward fT3 enhancing thermogenesis and metabolic activity to counteract excessive nutrient loads, suggesting that elevated fT3 levels are not necessarily a cause of obesity but rather a response to it.[14,16]
Our study did not find a significant correlation between TSH, fT3, fT4, or the fT3/fT4 ratio with waist circumference. However, some studies, such as the Lifelines Cohort Study conducted in the Netherlands, reported a positive relationship between elevated fT3 and waist circumference.[17] Kitahara et al. found that in euthyroid adults, BMI and waist circumference were positively correlated with TSH and fT3, but not with fT4, suggesting that thyroid function could influence abdominal obesity.[18]
Ambrosi et al. and Lai et al. also reported positive correlations between TSH and waist circumference, supporting the idea that elevated TSH levels could be linked to visceral fat accumulation.[19,20] De Pergola et al. found a negative correlation between fT4 and waist circumference, whereas Mehran et al. observed a positive relationship between lower fT4 levels and waist circumference.[10,12] Yang et al. found that in postmenopausal women, fT3 was positively correlated with visceral fat, while fT4 was negatively correlated, further supporting the idea of differential roles for thyroid hormones in metabolic syndrome components.[21]
These contrasting findings emphasize the complexity of the relationship between thyroid hormones and abdominal obesity. De Pergola and Knudsen suggested that the fT3/fT4 ratio may reflect increased peripheral conversion of fT4 to fT3, contributing to enhanced visceral fat accumulation through increased sympathetic activity and energy expenditure.[10,22]
In our study, the lack of significant correlations between TSH, fT3, fT4, and the fT3/fT4 ratio with waist circumference may be due to the retrospective nature of the study, where measurements were taken by different individuals. This heterogeneity could have introduced variability in the data, potentially affecting the results. Additionally, factors such as smoking, menopause, and dietary influences—known to impact thyroid hormone levels—were not accounted for, which could have influenced the observed correlations.
TSH and HDL cholesterol levels were shown to be significantly correlated negatively in our study. Similarly, after controlling for age and sex, Roos et al. found a favorable connection between TSH and triglycerides.[11] While lower fT4 levels and higher fT3/fT4 ratios were associated with elevated triglycerides and decreased HDL cholesterol levels, Xu et al. showed that greater TSH levels were favorably connected with triglyceride levels, regardless of obesity status.[6] Higher fT3, higher fT3/fT4 ratios, higher triglyceride levels, and lower HDL cholesterol were all positively correlated, according to Jin et al.[15]
Waterhouse et al. reported that after adjusting for BMI, the relationship between TSH and triglycerides was no longer significant, suggesting that factors such as age, sex, obesity, and diet could affect the observed correlations between thyroid hormones and lipid metabolism.[23] Mehran et al. also found no significant correlation between TSH and lipid profile after adjusting for confounding factors, reinforcing the complexity of these relationships.[12]
Jin et al. indicated that thyroid hormone impacts lipid metabolism within the normal thyroid function range, suggesting that even small variations in thyroid hormone levels could affect lipid profiles.[15] Xu et al. proposed that lipid values might be sensitive to small changes in the Hypothalamus-Pituitary-Thyroid (HPT) axis, which could help explain the observed correlations.[6] Walczak and Sieminska highlighted that lipid accumulation outside of adipose tissue in individuals with obesity could lead to lipotoxicity, which might impair thyroid function and exacerbate lipid metabolism disturbances.[24] Jin et al. further proposed that leptin elevation in individuals with obesity could affect the HPT axis, contributing to lipid metabolism dysregulation, although further research is required to validate these mechanisms.[15]
In line with earlier research, we found a negative relationship between HDL cholesterol levels and TSH, fT3, and the fT3/fT4 ratio. However, our focus on women only and the elimination of confounding factors like smoking, menopause, and diet may have contributed to the lack of significant correlations between fT4 and triglycerides or HDL cholesterol, as well as between fT3, fT3/fT4 ratios, and triglycerides.
While there was no significant link between age and TSH or fT4, we did find a significant negative correlation between age and fT3 and the fT3/fT4 ratio. Age and fT3 and TSH were found to be negatively correlated by Spira and De Pergola, respectively.[10,25] According to Wolffenbuttel, TSH and fT4 levels stay largely constant with aging, but fT3 levels decline.[16]
These findings suggest that age-related changes in thyroid hormone levels could be influenced by reduced TSH bioactivity, decreased hypothalamic sensitivity to thyroid hormones, alterations in serum leptin levels, and increased systemic inflammation, which may impact hypothalamic regulation. Reduced peripheral 5-deiodinase activity, leading to decreased conversion of fT4 to fT3, could also contribute to lower fT3 levels with aging. [7]
Limitations
This study has several limitations that should be considered when interpreting the results. First, the cross-sectional design limits the ability to draw causal inferences between thyroid hormone levels and metabolic parameters. While associations were observed, the direction of these relationships remains unclear. Second, the study was conducted in a single-center tertiary hospital in Istanbul, which may limit the generalizability of the findings to broader populations with diverse cultural and socioeconomic backgrounds.
Another limitation is the use of self-reported data, which could introduce recall or reporting bias, particularly in the collection of demographic and clinical characteristics. Furthermore, the study sample was restricted to women aged 18–65, meaning that the results may not be applicable to men or individuals outside this age range. Future studies with larger, multicenter samples, longer follow-up periods, and more comprehensive data collection methods are needed to further clarify the relationships between thyroid hormones and metabolic parameters.
Conclusion
This study demonstrated significant associations between thyroid hormone levels within the reference range and several metabolic markers in euthyroid women. Specifically, fT3 levels were negatively associated with HDL-C and positively associated with BMI and insulin resistance. Additionally, the fT3/fT4 ratio was found to correlate positively with insulin resistance and negatively with HDL-C. TSH was weakly but significantly associated with both triglyceride levels and BMI.
These findings suggest that even in the absence of overt thyroid dysfunction, variations in thyroid hormones may reflect or contribute to adverse metabolic profiles. Monitoring the fT3/fT4 ratio and fT3 levels may offer additional insights for assessing metabolic risk in individuals with obesity or insulin resistance.
Given the cross-sectional nature of this study, causal relationships cannot be established. Further prospective studies are warranted to clarify whether subtle shifts in thyroid hormone dynamics within the euthyroid range have prognostic value in metabolic health.
Ethical approval
This study has been approved by the İstanbul Medeniyet University Göztepe Training and Research Hospital Clinical Research Ethics Committee (approval date 27.09.2023, number 2023/0637). Informed consent was obtained from all patients before their participation.
Source of funding
The authors declare the study received no funding.
Conflict of interest
The authors declare that there is no conflict of interest.
Referanslar
- Durgun Z, Yazıcı C, İnan AO. Tiroit hormonları ve hastalıkları. Mediterr J Sport Sci. 2019;2(1):28-40.
- Iwen KA, Schröder E, Brabant G. Thyroid hormones and the metabolic syndrome. Eur Thyroid J. 2013;2(2):83-92. https://doi.org/10.1159/000351249
- Turkish Endocrinology and Metabolism Society. Metabolik sendrom kılavuzu. Available at: https://file.temd.org.tr/Uploads/publications/others/metabolik_sendrom.pdf (Accessed on June 26, 2024).
- Štěpánek L, Horáková D, Štěpánek L, et al. Free triiodothyronine/free thyroxine (FT3/FT4) ratio is strongly associated with insulin resistance in euthyroid and hypothyroid adults: a cross-sectional study. Endokrynol Pol. 2021;72(1):8-13. https://doi.org/10.5603/EP.a2020.0066
- World Health Organization (WHO). Obesity and overweight. Available at: https://www.who.int/news-room/fact-sheets/detail/obesity-and-overweight (Accessed on May 20, 2024).
- Xu R, Huang F, Zhang S, Lv Y, Liu Q. Thyroid function, body mass index, and metabolic risk markers in euthyroid adults: a cohort study. BMC Endocr Disord. 2019;19(1):58. https://doi.org/10.1186/s12902-019-0383-2
- Mele C, Mai S, Cena T, et al. The pattern of TSH and fT4 levels across different BMI ranges in a large cohort of euthyroid patients with obesity. Front Endocrinol (Lausanne). 2022;13:1029376. https://doi.org/10.3389/fendo.2022.1029376
- Tramunt B, Smati S, Grandgeorge N, et al. Sex differences in metabolic regulation and diabetes susceptibility. Diabetologia. 2020;63(3):453-461. https://doi.org/10.1007/s00125-019-05040-3
- Park HT, Cho GJ, Ahn KH, et al. Thyroid stimulating hormone is associated with metabolic syndrome in euthyroid postmenopausal women. Maturitas. 2009;62(3):301-305. https://doi.org/10.1016/j.maturitas.2009.01.007
- De Pergola G, Ciampolillo A, Paolotti S, Trerotoli P, Giorgino R. Free triiodothyronine and thyroid stimulating hormone are directly associated with waist circumference, independently of insulin resistance, metabolic parameters and blood pressure in overweight and obese women. Clin Endocrinol (Oxf). 2007;67(2):265-269. https://doi.org/10.1111/j.1365-2265.2007.02874.x
- Roos A, Bakker SJL, Links TP, Gans ROB, Wolffenbuttel BHR. Thyroid function is associated with components of the metabolic syndrome in euthyroid subjects. J Clin Endocrinol Metab. 2007;92(2):491-496. https://doi.org/10.1210/jc.2006-1718
- Mehran L, Amouzegar A, Tohidi M, Moayedi M, Azizi F. Serum free thyroxine concentration is associated with metabolic syndrome in euthyroid subjects. Thyroid. 2014;24(11):1566-1574. https://doi.org/10.1089/thy.2014.0103
- Kim BJ, Kim TY, Koh JM, et al. Relationship between serum free T4 (FT4) levels and metabolic syndrome (MS) and its components in healthy euthyroid subjects. Clin Endocrinol (Oxf). 2009;70(1):152-160. https://doi.org/10.1111/j.1365-2265.2008.03304.x
- Tarcin O, Abanonu GB, Yazici D, Tarcin O. Association of metabolic syndrome parameters with TT3 and FT3/FT4 ratio in obese Turkish population. Metab Syndr Relat Disord. 2012;10(2):137-142. https://doi.org/10.1089/met.2011.0098
- Jin Q, Huang G, Tian X, Shu Y, Tusongtuoheti X, Mao Y. High free triiodothyronine and free-triiodothyronine-to-free-thyroxine ratio are associated with metabolic syndrome in a euthyroid employee population: the Zhejiang Zhenhai study. Endocr Connect. 2023;12(5), e220424. https://doi.org/10.1530/EC-22-0424
- Wolffenbuttel BHR, Wouters HJCM, Slagter SN, et al. Thyroid function and metabolic syndrome in the population-based LifeLines cohort study. BMC Endocr Disord. 2017;17(1):65. https://doi.org/10.1186/s12902-017-0215-1
- Roef G, Lapauw B, Goemaere S, et al. Body composition and metabolic parameters are associated with variation in thyroid hormone levels among euthyroid young men. Eur J Endocrinol. 2012;167(5):719-726. https://doi.org/10.1530/EJE-12-0447
- Kitahara CM, Platz EA, Ladenson PW, Mondul AM, Menke A, Berrington de González A. Body fatness and markers of thyroid function among U.S. men and women. PLoS One. 2012;7(4):e34979. https://doi.org/10.1371/journal.pone.0034979
- Ambrosi B, Masserini B, Iorio L, et al. Relationship of thyroid function with body mass index and insulin-resistance in euthyroid obese subjects. J Endocrinol Invest. 2010;33(9):640-643. https://doi.org/10.1007/BF03346663
- Lai Y, Wang J, Jiang F, et al. The relationship between serum thyrotropin and components of metabolic syndrome. Endocr J. 2011;58(1):23-30. https://doi.org/10.1507/endocrj.k10e-272
- Yang Q, Wan YH, Hu SD, Cao YH. Associations between the levels of thyroid hormones and abdominal obesity in euthyroid post-menopausal women. Endokrynol Pol. 2020;71(4):299-305. https://doi.org/10.5603/EP.a2020.0037
- Knudsen N, Laurberg P, Rasmussen LB, et al. Small differences in thyroid function may be important for body mass index and the occurrence of obesity in the population. J Clin Endocrinol Metab. 2005;90(7):4019-4024. https://doi.org/10.1210/jc.2004-2225
- Waterhouse DF, McLaughlin AM, Walsh CD, Sheehan F, O’Shea D. An examination of the relationship between normal range thyrotropin and cardiovascular risk parameters: a study in healthy women. Thyroid. 2007;17(3):243-248. https://doi.org/10.1089/thy.2006.0208
- Walczak K, Sieminska L. Obesity and thyroid axis. Int J Environ Res Public Health. 2021;18(18):9434. https://doi.org/10.3390/ijerph18189434
- Spira D, Buchmann N, Dörr M, et al. Association of thyroid function with insulin resistance: data from two population-based studies. Eur Thyroid J. 2022;11(2):e210063. https://doi.org/10.1530/ETJ-21-0063
Telif hakkı ve lisans
Telif Hakkı © 2025 Yazar(lar). Açık erişimli bu makale, orijinal çalışmaya uygun şekilde atıfta bulunulması koşuluyla, herhangi bir ortamda veya formatta sınırsız kullanım, dağıtım ve çoğaltmaya izin veren Creative Commons Attribution License (CC BY) altında dağıtılmıştır.


