Öz
Objective: The aim of this study was to develop the “Scale for the Assessment of Mothers’ Readiness for the Transition to Complementary Feeding” and to examine its psychometric properties.
Methods: This methodological and cross-sectional study was conducted with 200 mothers of infants aged 4–6 months between March 2023 and October 2023. Content validity was assessed through expert evaluation. Construct validity was examined using exploratory and confirmatory factor analyses. Reliability was evaluated using Cronbach’s alpha, McDonald’s omega, composite reliability, and intraclass correlation coefficient.
Results: The final scale consisted of 10 items with a unidimensional structure. Internal consistency was good (α=0.827; ω=0.828; CR=0.85). The average variance extracted was below the recommended threshold (AVE=0.38). Test–retest reliability indicated good temporal stability (ICC=0.87, 95% CI [0.77–0.93]).
Conclusion: The scale demonstrated satisfactory reliability and construct validity and may serve as a useful tool for assessing mothers’ readiness for the transition to complementary feeding. However, further studies are needed to evaluate convergent and discriminant validity and to confirm its applicability across different populations.
Anahtar Kelimeler: breast feeding, weaning, mothers, infant, infant health
Introduction
Adequate nutrition in the first two years of life is essential for the complete development of human potential. Complementary feeding plays a key role in the physical, intellectual, and emotional development of infants during this period.[1,2] Complementary feeding is defined as the process that starts when breast milk alone becomes inadequate to meet infants’ nutritional needs and, therefore, there is a need for other foods and liquids along with breast milk.[3,4] It typically covers a period of 6-24 months.[5]
World Health Organization (WHO) and United Nations International Children's Emergency Fund (UNICEF) recommend that infants be exclusively breastfed for the first six months, complementary foods be introduced after the sixth month, and breastfeeding be continued until 24 months and beyond.[5,6] According to the 2020 Global Nutrition Report data, the rate of exclusive breastfeeding for the first six months in 2018 was 42%, while the rate of introducing complementary foods in infants aged 6-8 months was 69.5%. According to the above-mentioned report, it is aimed to increase the rate of exclusive breastfeeding in the first six months to a minimum of 50% or more in 2025.[7] Additionally, WHO and UNICEF report that they aim to increase this rate to at least 70% by 2030.[8] In line with these goals, it is essential to switch to complementary feeding in a timely manner.
The time for introducing complementary feeding is among the most discussed issues. Inadequate, early, or late transition to complementary feeding may have negative consequences in the short and long terms.[1,2,5,9] Upon reviewing studies in the literature, the rate of early introduction of complementary foods is found to be high.[6,10] There is evidence indicating that introducing complementary foods before the sixth month (early period) is associated with the risk of childhood overweight.[9-11] Micronutrient deficiencies that may occur due to the late introduction of complementary feeding is another important issue.[12] It is known that such nutrition-related problems in the first year of life also cause chronic diseases such as stunting, obesity, cardiovascular diseases, diabetes, and hypertension.[11,13]
Complementary feeding has numerous dimensions, such as its timely initiation, as well as providing sensitive nutrition and safe delivery of appropriate foods in the amount, frequency, and consistency to meet the nutritional needs of a growing child while maintaining breastfeeding by taking precautions to minimize the risk of contamination with pathogens.[5,14] In this process, the knowledge and attitudes of mothers, who are the primary caregivers, represent a determining factor in the feeding practices of their children.[1,6,15] Hence, it is important for mothers to be ready for the transition periods concerning their infants’ nutrition.[15]
In the literature review, a measurement tool in Spanish developed to measure mothers' knowledge about complementary feeding was found, whereas no similar scale developed to assess their readiness was encountered.[2] A scale for the assessment of mothers' readiness for the transition to complementary feeding will be useful to midwives, nurses, and other healthcare professionals to determine the educational needs of mothers on the issue. Furthermore, it will be useful for educating mothers in line with individual needs, in individualized care practices, and in providing individualized educational needs.
The aim of this study was to develop the ‘Scale for the Assessment of Mothers’ Readiness for the Transition to Complementary Feeding’ and to examine its psychometric properties.
Conceptual definition and theoretical underpinnings
The concept of “readiness” in health behavior is widely recognized as a multidimensional construct encompassing cognitive, affective, motivational, and behavioral components[16,17] In the context of maternal and child health, readiness for the transition to complementary feeding reflects not only a mother’s knowledge about appropriate feeding practices but also her attitudes, perceived competence, confidence, and intention to initiate and sustain appropriate feeding behaviors.
Several theoretical frameworks support the conceptualization of readiness as a complex and dynamic construct. The Health Belief Model (HBM) posits that health-related behaviors are influenced by individuals’ perceptions of susceptibility, severity, benefits, and barriers, as well as cues to action and self-efficacy.[18] Within this framework, a mother’s readiness to initiate complementary feeding may depend on her beliefs about the benefits of timely feeding, perceived risks of inappropriate practices, and her confidence in her ability to implement feeding recommendations.
Similarly, Self-Efficacy Theory emphasizes the role of perceived capability in performing specific behaviors. Maternal self-efficacy has been identified as a key determinant of infant feeding practices, influencing both the initiation and maintenance of appropriate complementary feeding behaviors.[17,19] Mothers who perceive themselves as competent are more likely to demonstrate readiness and engage in recommended practices.
The Transtheoretical Model (Stages of Change) further conceptualizes readiness as a process that evolves over time, progressing from precontemplation to maintenance.[20] In this model, readiness is not a static state but reflects an individual’s position within a behavioral change continuum. Applied to complementary feeding, mothers may vary in their preparedness depending on their stage of awareness, intention, and prior experience.
Based on these frameworks, readiness for complementary feeding can be conceptualized as comprising multiple interrelated dimensions, including: (I) cognitive readiness (knowledge and awareness), (II) affective readiness (attitudes and beliefs), (III) motivational readiness (intention and willingness), (IV) behavioral readiness (practical preparedness), (V) self-efficacy (perceived competence), and (VI) contextual readiness (environmental and social support).[16,17]
This conceptualization provides the theoretical basis for the development and validation of the present scale and supports its use as a practical tool in maternal and child health settings, particularly in primary care and nursing practice.
Methods
Study design
This study was designed as a methodological and cross-sectional research. The study was conducted in accordance with COSMIN and APA guidelines for scale development and reporting.
Participants recruitment
The study was carried out in the pediatric outpatient clinics of two hospitals in Türkiye between March 2023 and October 2023. The population of the study comprised mothers of 4-6-month-old infants who presented to the pediatric outpatient clinics of a district state hospital and a provincial training and research hospital in the Black Sea Region of Türkiye.
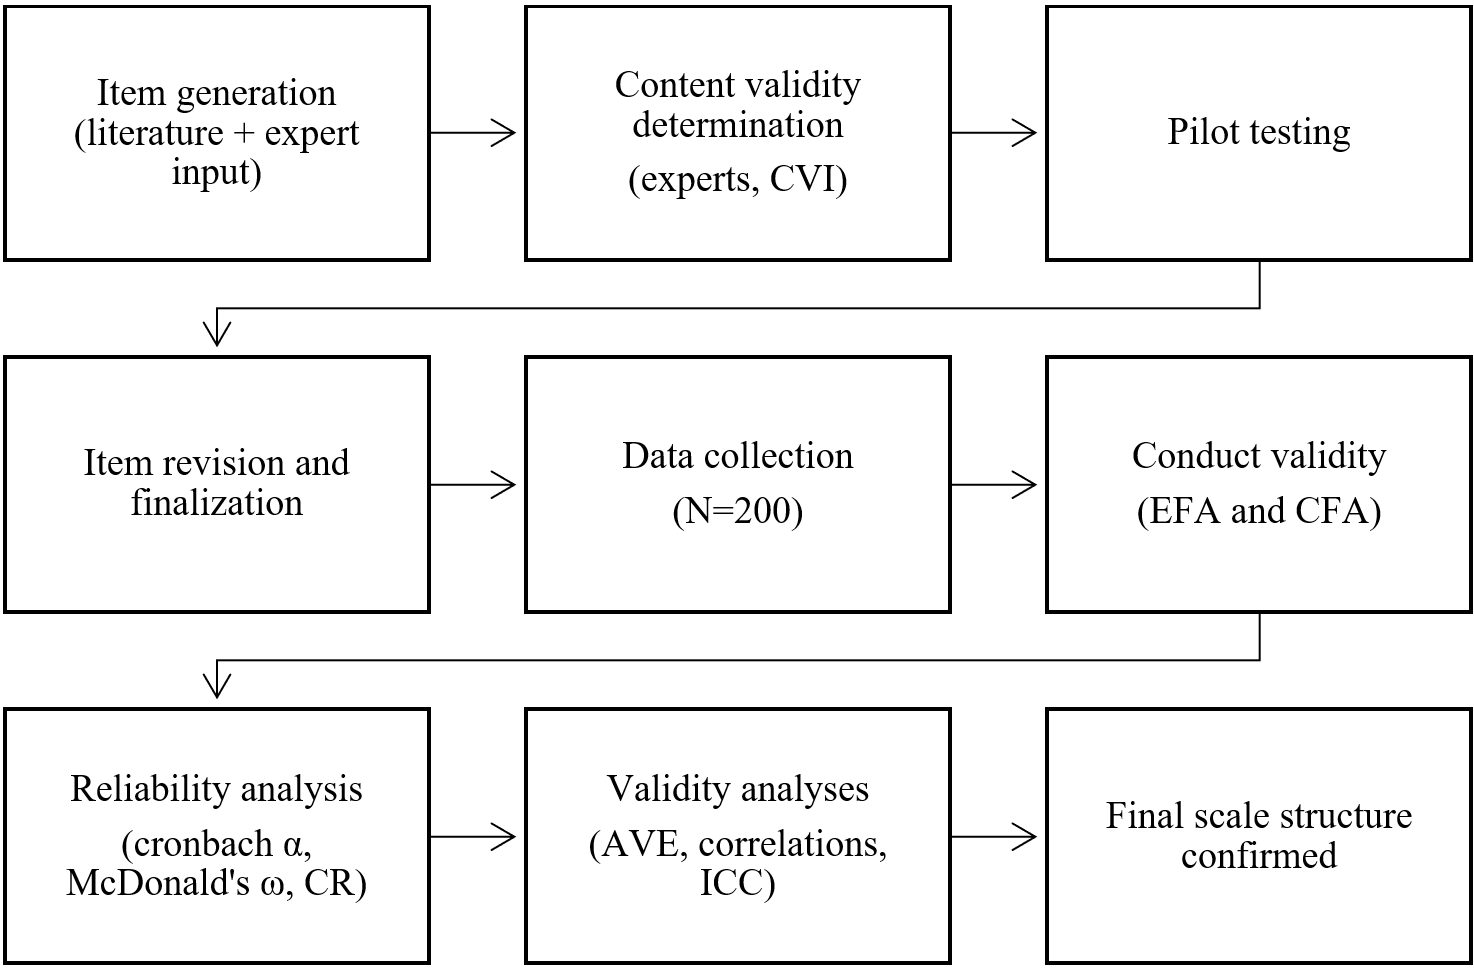
Inclusion criteria were: Having a 4-6-month-old typically developing infant, being literate, volunteering to take part in the research, being open to communication and collaboration, not having a diagnosed psychiatric disease, the absence of a disease or special needs in their infants that may affect infants’ nutrition was included. Who filling out the data collection forms incompletely were excluded and nobody filled out the forms incompletely. Participants were recruited using a consecutive sampling method, whereby all individuals who met the inclusion criteria and presented to the study setting during the data collection period were invited to participate, the study achieved a 100% response rate. A flow diagram of the scale development process was presented in Figure 1 to ensure methodological transparency.
Sample size was determined based on the participant-to-item ratio, which is widely recommended in scale development studies. A minimum of 5–10 participants per item is suggested to ensure stable factor solutions.[21,22] Accordingly, the present study included 200 participants for a 20-item scale (10:1 ratio), which is considered adequate for reliable factor analysis and consistent with methodological recommendations.[23-28]
In line with this information, 200 mothers who met the inclusion criteria and agreed to take part in the research constituted the sample for the draft form of the 20-item scale.
Prior to the data collection stage, a pilot study was conducted with 15 mothers who had the same characteristics as the sample group. The comprehensibility of the items in the scale draft was tested. It was evaluated that there was no incomprehensible statement after the pilot study. Mothers who took part in the pilot study were not included in the sample.
Data collection tools
The data were collected with the "Descriptive Information Form" prepared by the researchers and the draft form of the "Scale for the Assessment of Mothers' Readiness for the Transition to Complementary Feeding" developed by the researchers to assess mothers’ readiness for the transition to complementary feeding. The survey and interview methods were employed when collecting data. It was ensured that all mothers who agreed to take part in the research and met the inclusion criteria filled out the descriptive information form and the scale draft.
Descriptive information form
This form includes 13 questions about parents’ sociodemographic characteristics (age, educational status, employment status, etc.) and the child’s age and gender.
Draft form of the scale
A seven-point Likert scale draft consisting of 21 items was prepared in line with the researchers’ knowledge/experience and literature research concerning the transition to complementary feeding, readiness, and Likert scale development. The draft scale was presented to expert opinion to evaluate whether it was suitable for the measurement purpose and whether it covered the subject to be measured. First, a list was created of experts who had conducted research on the subject, possessed relevant expertise, and had parenting/motherhood experience. Expert opinion forms were sent via email to a total of 20 experts. Of the 20 experts [eight academicians in the field of pediatric nursing (7) and midwifery (1), two specialist doctor in the field of child health and a dietitian], 11 responded to the email. Afterward, an educator specialized in Turkish language and literature evaluated the draft scale reviewed by the researchers in terms of language and expression. In line with the recommendations from experts, the final version of the scale draft was revised before implementation. As a result of the evaluations, one inappropriate item (I can ensure my baby is fed at the family dinner table) was removed and the draft scale consisted of 20 items.
Statistical analysis
Data were analyzed using SPSS (IBM SPSS Statistics for Windows, Version 25.0), AMOS (Version 21), JASP, and Jamovi software. Descriptive statistics were presented as frequencies and percentages for categorical variables, and means, standard deviations, minimum, and maximum values for continuous variables. Exploratory and confirmatory factor analyses were performed to assess construct validity. A significance level of p<0.05 was considered statistically significant.
Validity and reliability
Content validity
Content validity was assessed using the Content Validity Index (CVI). Experts rated each item on a 4-point scale according to the Davis technique (1= Not appropriate at all, 2= Needs major revision, 3= Needs minor revision, 4= Very appropriate) in terms of relevance. The item-level CVI (I-CVI) was calculated as the proportion of experts rating the item as 3 or 4. Items with an I-CVI of 0.80 or higher were considered acceptable.[28,29] The scale-level CVI (S-CVI) was calculated as the average of the I-CVI values (S-CVI/Ave). The S-CVI/UA was calculated as the proportion of items that achieved universal agreement among experts. Items falling below the acceptable threshold were revised or removed (an item) based on expert feedback.
Construct validity
Construct validity was assessed through exploratory factor analysis (EFA) and confirmatory factor analysis (CFA) and further supported by composite reliability (CR) and average variance extracted (AVE).
Exploratory factor analysis (EFA)
Prior to exploratory factor analysis, the Kaiser-Meyer-Olkin (KMO) measure was used to assess sampling adequacy, and Bartlett’s test of sphericity was conducted to examine the suitability of the correlation matrix for factor analysis.[27] Exploratory factor analysis (EFA) was conducted on the 20-item draft scale using Principal Axis Factoring. Items were evaluated based on factor loadings (≥0.40) and cross-loadings. Items not meeting these criteria were removed to improve construct validity. After item refinement, a 10-item final form was obtained. Parallel analysis and scree plot inspection supported a single-factor solution. Since a unidimensional structure was retained, no rotation was applied.
Confirmatory factor analysis (CFA)
The compatibility between the factor structure identified in the exploratory factor analysis (EFA) and the hypothesized measurement model was examined using confirmatory factor analysis (CFA). A first-order one-factor model was specified. Model fit was evaluated using χ²/df, RMSEA, SRMR, CFI, and TLI. Model fit was assessed according to commonly accepted criteria (CFI and TLI ≥ 0.90, RMSEA ≤ 0.08, SRMR ≤ 0.08).[24,30,31] Modification indices were inspected, and correlated error terms were added between conceptually or methodologically related items (I1–I3 and I4–I7) to improve model fit. All analyses were conducted using standardized estimates.
Reliability
Cronbach's alpha coefficient was used to determine the internal consistency of the scale. The reliability coefficient for Cronbach’s alpha internal consistency is expected to be higher than 0.70, which is a generally acceptable value.[27] If the total score correlation coefficient of the scale is lower than 0.30, it can be concluded that there is a problem in the relevant items, and these items can be removed if they pose a serious problem.[32-34] The impact of the removed items on Cronbach’s alpha coefficient should be checked when deciding on removing items.[32,35] For reliability to be interpreted as good, the correlation coefficient should be 0.30 and above.32[/xRef],34] Therefore, during item removal, the effect on the item total score coefficient and Cronbach alpha coefficient was examined. In addition to Cronbach’s alpha, McDonald’s omega and composite reliability (CR) coefficients were calculated to provide more robust estimates of internal consistency.
To investigate whether the scale scores changed over time, the scale was re-applied to 35 participants two weeks later. The sample size for the test-retest analysis was determined in accordance with the recommendation in the literature to have at least 30 participants.[36-38] Participants who agreed to participate in the test-retest were included in the study. Test–retest reliability was assessed using ICC and supported by Pearson’s correlation analysis.
Ethical consideration
The research was approved by the Sakarya University Faculty of Medicine Non-Invasive Research Ethics Committee on [31 Jan 2023]. At every stage of the research, ethical principles in the Declaration of Helsinki were followed. Verbal and written informed consent was obtained from all participants.
Results
The mean age of the participating mothers was 30.6±5.4 [min 20.0-max 41.0]. Of the mothers, 41.5% were university graduates, and 67.5% were unemployed. The gender of 53.5% of the infants included in the research was male. Considering the age distribution of the infants, 36% were 4 months old, 44% were 5 months old, and 20% were 6 months old. Descriptive characteristics of the participants were presented in Table 1.
| Table 1. Descriptive characteristics of the participants (N=200). | ||
|
|
|
|
| Mean of mothers age (years) |
|
|
| Education level | Primary school |
|
| Middle school |
|
|
| High school |
|
|
| University |
|
|
| Working status | Unemployed (housewife) |
|
| Full time |
|
|
| Part time |
|
|
| Place of residence | Village/Town |
|
| District |
|
|
| City center |
|
|
| Income status | Income exceeds expenses |
|
| Income equals expenses |
|
|
| Income less than expenses |
|
|
| Family type | Nuclear family |
|
| Extended family |
|
|
| Number of children | Single child |
|
| Two child |
|
|
| Three child |
|
|
| Four child and above |
|
|
| Infant’s gender | Female |
|
| Male |
|
|
| Infant’s age (years) | 4 months |
|
| 5 months |
|
|
| 6 months |
|
|
Descriptive statistics indicated that total scores ranged from 50 to 70 (66.35±4.35).
Content validity
The item content validity index (I-CVI) calculated as a result of evaluations from 11 experts was found to be between 0.91 and 1.00 for all items. The S-CVI/Ave for the overall scale was 0.98. The S-CVI/UA was found to be 0.81.
Construct validity
The result of the KMO test applied to the structure consisting of 20 items prior to EFA was found to be 0.828. The result of Bartlett’s test of sphericity was statistically significant (χ2 (190) =1176.860 p<0.001). Conceptual domains of the draft items and results of the analysis before items extraction were presented in Supplementary Table S1.
Exploratory factor analysis was initially conducted on the full item pool, together with parallel analysis, which suggested a multi-factor structure. However, several items showed low factor loadings and cross-loadings and were therefore excluded based on predefined criteria. Following item reduction, the analyses were repeated with the remaining items.
The final exploratory factor analysis and parallel analysis results supported a unidimensional structure. The results of the exploratory factor analysis for the last 10 items of the scale were presented in Table 2. Accordingly, a single-factor solution was retained for the scale. The factor loadings of the remaining items ranged from 0.478 to 0.740.
| 'Principal axis factoring' extraction method was used in combination with a 'none' rotation | ||
| Table 2. Exploratory factor analysis results for the final 10-item scale (PAF). | ||
| Factor loadings | ||
| Items |
|
|
| I19 |
|
|
| I18 |
|
|
| I14 |
|
|
| I17 |
|
|
| I20 |
|
|
| I5 |
|
|
| I16 |
|
|
| I12 |
|
|
| I10 |
|
|
| I3 |
|
|
| Cronbach’s alpha |
|
|
| Eigenvalues |
|
|
| Explained variance |
|
|
| KMO= 0.850 X2(45)= 591.342; Bartlett Test (p)<0.001 | ||
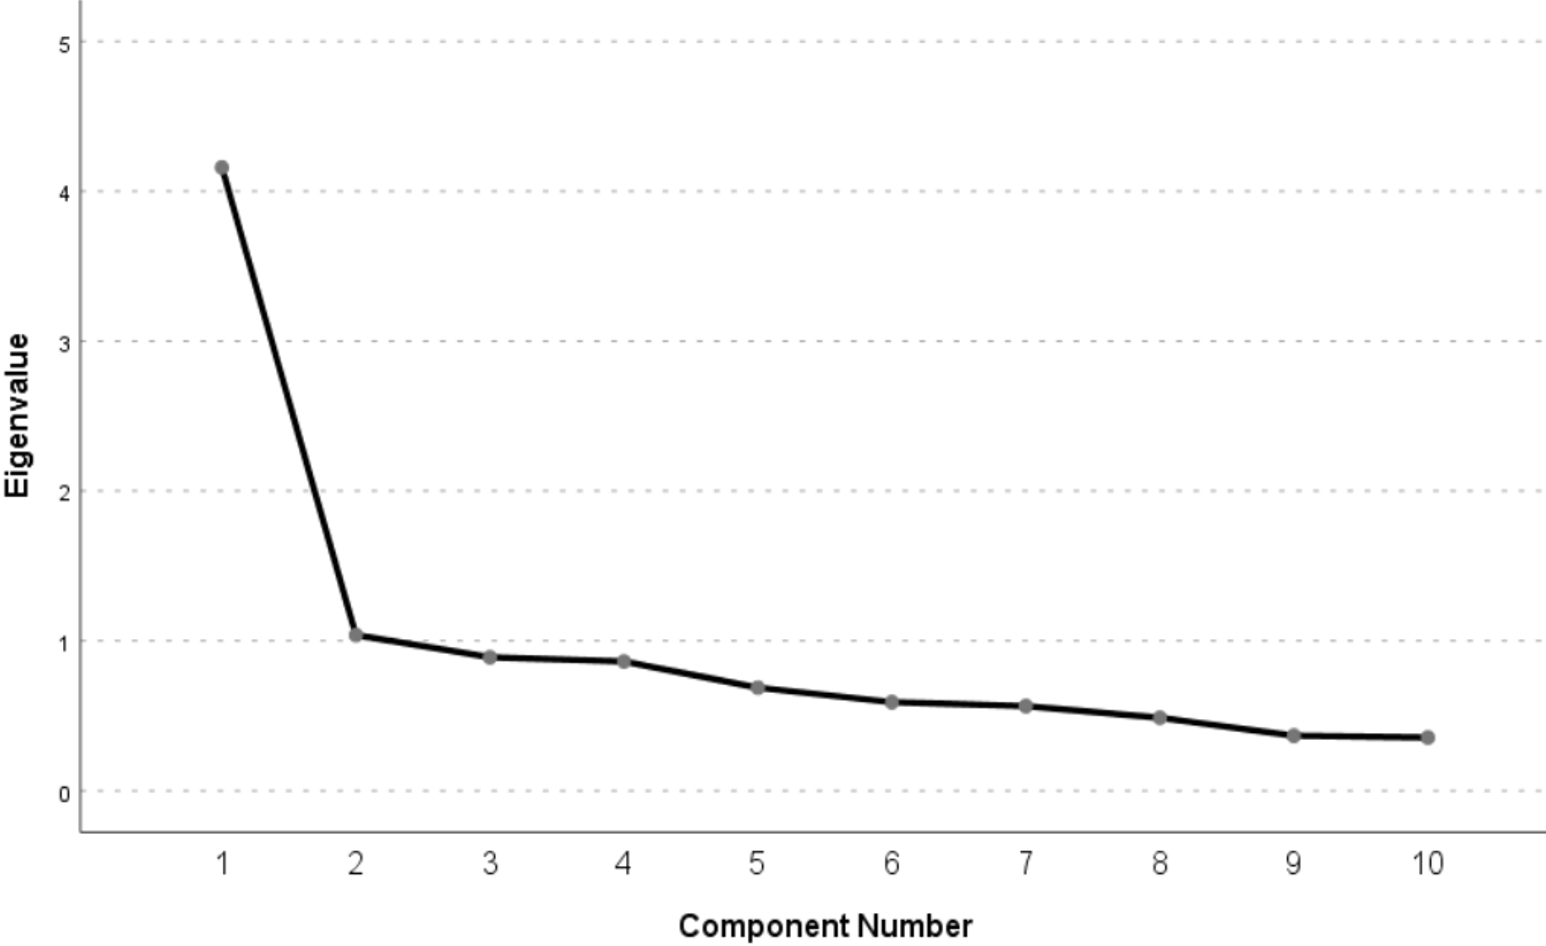
Inspection of the scree plot based on eigenvalues further confirmed the one-factor structure Scree plot for the final version of the model was presented in Figure 2. The final model had an eigenvalue greater than 1.00 and explained 41.6% of the total variance (Table 2). A first-order confirmatory factor analysis (CFA) was conducted to test the unidimensional structure of the scale, with the single latent factor representing the Scale for the Assessment of Mothers’ Readiness for the Transition to Complementary Feeding and the items specified as observed indicators. Confirmatory factor analysis of model was presented in Figure 3.
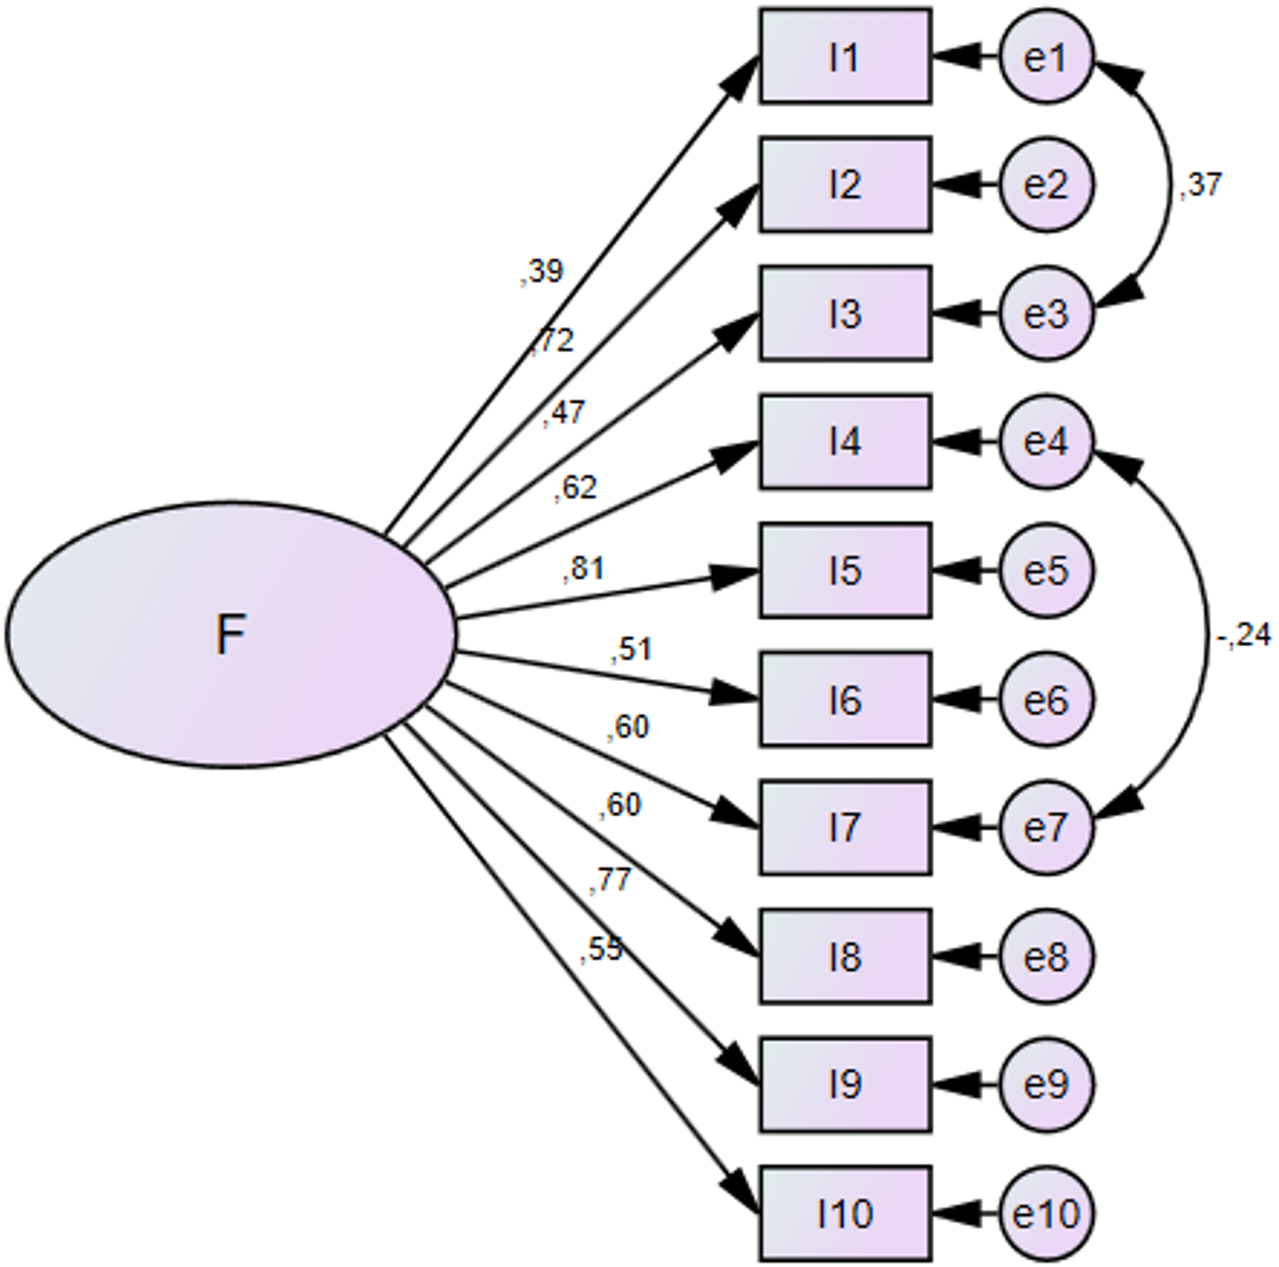
The CFA model demonstrated acceptable fit (χ²/df= 1.091, CFI= 0.963, TLI= 0.950, RMSEA= 0.021, SRMR= 0.077). Standardized factor loadings ranged from 0.39 to 0.81 and were statistically significant (p<0.001). Standardized factor loadings from confirmatory factor analysis (First-order model) were presented in Table 3.
| CR: Critical ratio; SE: Standard error | |||||
| Table 3. Standardized factor loadings from confirmatory factor analysis (first-order model). | |||||
| Items |
|
|
|
|
|
| I3 |
|
|
|
|
|
| I5 |
|
|
|
|
|
| I10 |
|
|
|
|
|
| I12 |
|
|
|
|
|
| I14 |
|
|
|
|
|
| I16 |
|
|
|
|
|
| I17 |
|
|
|
|
|
| I18 |
|
|
|
|
|
| I19 |
|
|
|
|
|
| I20 |
|
|
|
|
|
Reliability
The scale demonstrated good internal consistency (α=0.827; ω=0.828). Composite reliability was satisfactory (CR=0.85), whereas AVE was below the recommended level (0.38). Item-total correlations exceeded 0.30 for all items, and no item deletion was required. Split-half reliability also supported the stability of the scale.The test–retest reliability assessed in 35 participants with a two-week interval demonstrated a high level of stability (ICC=0.87, 95% CI [0.77–0.93]). Pearson’s correlation analysis further supported this finding, indicating a strong positive relationship between the two measurements (r=0.88, p<0.001).
Discussion
The literature review showed that there was no similar measurement tool developed to assess mothers' readiness for the transition to complementary feeding. It is thought that this scale developed will evaluate mothers’ readiness for the transition to complementary feeding and guide healthcare professionals in terms of eliminating the deficiencies in this regard in a timely manner. The current study revealed that the scale has a high level of reliability and adequately measures the construct it aims to measure.
Determining the validity and reliability of the tested measurement tool represent two important stages in the scale development process.[35,39] Validity refers to the ability of a measure to measure the trait of interest.[32,40] This study examined content and construct validity to test the scale’s validity. Expert opinion was sought to test the scale’s content validity.[32,40,41] The Davis technique was employed for expert opinion, and the CVI was calculated.[28,29] The content validity of the scale was evaluated using both item-level and scale-level indices. Item-content validity indices (I-CVI) vary between 0.91 and 1.00. The fit index of all items is above the criterion value of 0.80.[29] Also, S-CVI/Ave for the overall scale was 0.98, indicating excellent content validity.[42] The high S-CVI/Ave value indicates that the scale has strong content validity, supporting its adequacy in representing the construct of mothers’ readiness for complementary feeding. The Scale-Level Content Validity Index based on Universal Agreement (S-CVI/UA) was calculated as 0.81, indicating that 81% of the items achieved universal agreement among the experts. This finding suggests a high level of consensus regarding the relevance and representativeness of the items.[42]
In addition, the majority of items met the recommended content validity criteria, and only a limited number of items required minor revisions based on expert feedback. Overall, the content validity analysis demonstrated that the items adequately represent the theoretical construct, and the scale has strong content validity to support further psychometric evaluation.
At the construct validity stage, factor analysis was conducted to examine the relationships among the scale items. The suitability of the data for factor analysis was assessed using the Kaiser–Meyer–Olkin (KMO) measure and Bartlett’s test of sphericity. The KMO value was 0.828, indicating a good level of sampling adequacy, and Bartlett’s test of sphericity was statistically significant (p<0.001), confirming sufficient correlations among items for factor analysis. These results indicate that the data were appropriate for factor extraction.[26,39]
EFA and CFA were conducted to examine the construct validity of the scale.[27]
The results of the exploratory factor analysis, conducted using Principal Axis Factoring, consistently supported a unidimensional structure for the scale. The initial EFA of the full item pool suggested a multi-factor structure; however, several items demonstrated low factor loadings and cross-loadings and were subsequently removed based on predefined criteria. Following item reduction, the factor structure was re-evaluated, and both the scree plot and eigenvalue criteria indicated a dominant single factor. In addition, parallel analysis supported a one-factor solution. All retained items loaded at acceptable levels, indicating strong construct coherence. Taken together, these findings suggest that the scale measures a single underlying construct.[21,24,31]
Consequently, the exploratory factor analysis indicated a unidimensional structure explaining approximately 41.6% of the total variance, with an eigenvalue greater than 1.In the confirmatory factor analysis, the model fit indices were χ²/df=1.091, RMSEA=0.021, GFI=0.900, CFI=0.963, SRMR=0.077, and TLI=0.950. These values indicate a good model fit and support the adequacy of the proposed unidimensional structure.[27,32,39,43] Standardized factor loadings ranged between 0.390 and 0.806. Item 3 was retained due to its theoretical relevance to the construct despite its relatively lower factor loading.
Correlated error covariance between I1–I3 were included due to similar item wording and overlapping content related to sequencing of infant feeding practices, which may introduce shared measurement error. The correlated error covariance between I4 and I7 was included based on modification indices and may reflect shared method variance associated with self-report measurement. Modifications have applied cautiously and kept to a minimum to preserve the theoretical integrity of the model.
Reliability is the degree of consistency that a measurement displays when repeated under the same conditions.[28,32,35,40] Cronbach's alpha coefficient, McDonald’s omega and item-total score correlation coefficient are the most frequently utilized criteria to evaluate a scale’s internal consistency.[27,32,44] These reliability analyses are conducted to test whether the statements in the scale are consistent among themselves and whether all of the statements measure the same conceptual construct.[27,28,41] The value of 0.70 for Cronbach’s alpha coefficient is within acceptable limits. Furthermore, for high reliability, this value is expected to be 0.80 and above.[28,32,35] For reliability to be interpreted as good, the item-total score correlation coefficient must be 0.30 and above. If the item-total score correlation coefficient of the scale is lower than 0.30; it is decided to delete problematic items by examining the impact of these items on Cronbach’s alpha coefficient.[32,34] In the present work, when two items with the item-total score correlation coefficient below 0.30 were deleted, these items have removed since Cronbach’s alpha value changed significantly. McDonald’s omega (ω = 0.828) and Cronbach’s alpha (α = 0.827) have indicated good internal consistency of the scale.
The average variance extracted (AVE) values were below the recommended threshold of 0.50. However, composite reliability (CR) values exceeded 0.70, indicating adequate internal consistency. According to Fornell and Larcker (1981), convergent validity may still be considered acceptable when CR is above 0.60 despite low AVE values.[45] The relatively low AVE values may be attributed to the multifaceted nature of readiness, which encompasses diverse dimensions.
In this study, test–retest reliability was assessed two weeks later in a subsample of 35 participants to evaluate the temporal stability of the scale.[28,32,34,41] Although the period between these two measurements varies depending on the behavior measured and the target audience, it is generally stated that 2-4 weeks is an adequate period.[28,34] Additionaly, the use of a subsample of approximately 30 or more participants is considered acceptable for estimating test–retest reliability in scale development studies, particularly in early psychometric evaluation phases where feasibility and participant retention are important considerations. Methodological guidance suggests that sample sizes above 30 are generally sufficient to provide stable estimates of correlation-based reliability coefficients, including intraclass correlation coefficients (ICCs), when the instrument is newly developed and administered within a short retest interval.[37,38] Accordingly, the selection of 35 participants in the present study is consistent with recommended practice in psychometric research and provides an adequate basis for evaluating temporal stability.
The intraclass correlation coefficient found as a result of the test-retest analysis showed a high level of temporal stability (ICC=0.87, 95% CI [0.77–0.93]). This finding was further supported by Pearson’s correlation analysis.[24,28,29,32,46] which demonstrated a strong positive relationship between the two measurements (r=0.88, p<0.001). Although readiness may be considered a potentially dynamic construct, the high ICC suggests that the scale demonstrates strong temporal stability over the assessed time interval. Therefore, the scale can be considered a reliable tool for repeated measurements in similar populations.
This scale, developed as a result of the analyses, was evaluated to be a valid and reliable measurement tool for assessing mothers' readiness for the transition to complementary feeding.
The concept of “readiness” in health behavior is widely recognized as a multidimensional construct encompassing cognitive, affective, motivational, and behavioral components.[16,17] Although readiness is theoretically multidimensional, empirical findings in scale development studies may reveal a unidimensional structure, particularly when these components are highly interrelated and perceived holistically by respondents.[47,48] In the context of maternal decision-making regarding infant feeding, these dimensions may converge into a single overarching perception of readiness. Therefore, the emergence of a unidimensional factor structure in the present study may reflect the integrated and practical nature of readiness as experienced by mothers.This structure enhances its practical utility in clinical and primary care settings, where brief, integrative assessments are often preferred for screening and decision-support purposes. Nevertheless, future research should examine whether multidimensional models may emerge in different populations or cultural contexts, and whether more granular subdimensions could improve predictive validity in intervention studies.
The descriptive results indicated that total readiness scores ranged from 50 to 70, with a relatively high mean score (66.35±4.35). This suggests that participants generally reported high levels of readiness for the transition to complementary feeding. The relatively narrow standard deviation and the clustering of scores toward the upper end of the scale may indicate a potential ceiling effect within the current sample.This pattern may be attributed to the characteristics of the study sample, which consisted of mothers of infants aged 4–6 months who may already have been exposed to information or support regarding infant feeding practices. Alternatively, it may reflect generally high levels of perceived readiness in this population. Future studies with more diverse samples are recommended to further examine the scale’s ability to discriminate across different levels of readiness, particularly in populations with lower baseline knowledge or support.
To the best of our knowledge, this is one of the first scales developed in Türkiye addressing mothers’ readiness for the transition to complementary feeding. However, the study has some limitations. The sample consisted of Turkish mothers with normally developing infants aged 4-6 months. Although the instrument demonstrated acceptable psychometric properties within a Turkish sample, its validity across different cultural and healthcare contexts has not yet been established. Health-related constructs such as readiness for complementary feeding are known to be influenced by cultural norms, feeding practices, and maternal beliefs, which may vary substantially across populations.[49,50] Therefore, measurement equivalence cannot be assumed without formal cross-cultural validation procedures, such as measurement invariance testing. Future research should examine the factorial structure of the scale in diverse cultural settings and assess whether the construct of readiness is interpreted similarly across populations. Such studies are essential to ensure the generalizability and broader applicability of the instrument in international maternal and child health research.
Although the present study included an acceptable sample size for factor analytic procedures, methodological literature suggests that larger samples may provide more stable and generalizable parameter estimates in scale development studies. While sample sizes of 200 or more are generally considered adequate for exploratory and confirmatory factor analyses, recent psychometric research emphasizes that larger samples contribute to improved stability and replicability of factor structures, particularly in models with higher complexity or weaker factor loadings.[23,24] In addition, cross-validation procedures, which are recommended to further strengthen construct validity, typically require sufficiently large samples that can be split into independent subsamples for exploratory and confirmatory analyses. Therefore, the sample size of the current study may be considered sufficient but relatively limited in terms of fully supporting cross-validation procedures and maximizing the robustness and generalizability of the findings. Future studies with larger and more diverse samples are recommended to further validate the factor structure, enable cross-validation analyses, and strengthen the psychometric evidence of the scale.[21,24]
Although the present study provides strong evidence for the factorial validity and internal consistency of the scale, certain limitations should be acknowledged. First, the study primarily focused on factorial validity, and evidence based on external validity was not fully examined. In particular, convergent and discriminant validity could not be assessed due to the absence of additional theoretically related and unrelated constructs in the dataset. Therefore, future research is recommended to evaluate the relationships of the scale with constructs such as maternal self-efficacy and parenting stress to further establish its construct validity.
In addition, predictive validity was not examined within the scope of this cross-sectional design. Longitudinal studies are therefore needed to determine whether readiness scores can predict subsequent infant feeding practices over time. The scale was designed as a continuous measure of readiness for research purposes rather than a diagnostic or screening tool. Therefore, no cut-off score was established. Future studies may explore the potential for defining clinically meaningful thresholds using ROC analysis when external criterion variables become available.
According to the recommendations of health authorities such as WHO and UNICEF, it is important that healthcare professionals monitor exclusive breastfeeding for the first six months of typically developing infants who do not have any nutrition-related health problems and evaluate mothers’ readiness for the transition to complementary feeding when their infants are 4-6 months old to ensure timely transition to complementary feeding.
In this regard, healthcare professionals can use the measurement tool developed as a checklist. Using it in this way will be beneficial both in supporting and monitoring infants' exclusive breastfeeding for the first six months and in planning the necessary early education and consultancy services in line with the needs of mothers who need to be supported in the transition to complementary feeding.
The scale is designed as a unidimensional continuous measure of mothers’ readiness for the transition to complementary feeding and is intended primarily for research purposes and for informing clinical awareness rather than for diagnostic classification. Each item of the 10-item, seven-point Likert-type scale is scored from 1 (“I am not ready at all”) to 7 (“I am completely ready”). The total score is obtained by summing all item scores, yielding a range between 10 and 70, with higher scores indicating greater readiness. There are no reverse-coded items. Although item-level responses may be examined descriptively, the primary interpretation of the scale is based on the total score. The scale was validated in a sample of mothers of typically developing infants aged 4–6 months.
Ethical approval
This study has been approved by the Sakarya University Faculty of Medicine Non-Invasive Researchs Ethics Committee (approval date 31.01.2023, number E-71522473-050.01.04-216162-01). Written informed consent was obtained from the participants.
Source of funding
The authors declare the study received no funding.
Conflict of interest
The authors declare that there is no conflict of interest to disclose.
Generative AI statement
During the preparation and revision of this manuscript, we used ChatGPT (OpenAI) for language and stylistic editing and for technical guidance regarding the installation and use of statistical softwares (jamovi and jasp) for the additional analyses requested during the revision process. The statistical analyses were performed by the authors using the statistical softwares, and the resulting analyses and outputs were reviewed and verified by the authors. After using this tool, we reviewed and evaluated the information provided as appropriate and take full responsibility for the content, analyses, and conclusions of the publication.”
Referanslar
- Matvienko-Sikar K, Kelly C, Sinnott C, et al. Parental experiences and perceptions of infant complementary feeding: a qualitative evidence synthesis. Obes Rev. 2018;19(4):501-517. https://doi.org/10.1111/obr.12653
- Sierra-Zúñiga M, Holguin Betancourt C, Mera-Mamián AY, Delgado-Noguera M, Calvache JA. Construction and validation of an instrument to measure knowledge of mothers and caregivers on complementary feeding of infants. Rev Chil Pediatr. 2020;91(5):711-721. https://doi.org/10.32641/rchped.vi91i5.1078
- English LK, Obbagy JE, Wong YP, et al. Complementary feeding and developmental milestones: a systematic review. Am J Clin Nutr. 2019;109(Suppl 7):879S-889S. https://doi.org/10.1093/ajcn/nqy321
- Pan American Health Organization; World Health Organization (WHO). Guiding principles for complementary feeding of the breastfed child. WHO; 2003. Available at: https://www.who.int/publications/i/item/9275124604 (Accessed on Dec 3, 2025).
- World Health Organization (WHO). Guidance on ending the inappropriate promotion of foods for infants and young children: implementation manual. 2017. Available at: https://apps.who.int/iris/bitstream/handle/10665/260137/9789241513470-eng.pdf (Accessed on Dec 3, 2025).
- Akın B, Demir E, Gürdal A, Yılmaz S. Attitudes of mothers with babies aged 0-6 months regarding infant nutrition and transition times to complementary feeding. Acıbadem Üniversitesi Sağlık Bilimleri Dergisi. 2021;12(2):472-478. https://doi.org/10.31067/acusaglik.849205
- Development Initiatives. Global Nutrition Report 2020: action on equity to end malnutrition. Bristol (UK): development initiatives; 2020. Available at: https://globalnutritionreport.org/reports/2020-global-nutrition-report/ (Accessed on Dec 3, 2025).
- World Health Organization (WHO); United Nations Children's Fund (UNICEF). The extension of the 2025 maternal, infant and young child nutrition targets to 2030: discussion paper. UNICEF; 2025. Available at: https://data.unicef.org/resources/who-unicef-discussion-paper-nutrition-targets (Accessed on Dec 3, 2025).
- Padhani ZA, Das JK, Siddiqui FA, et al. Optimal timing of introduction of complementary feeding: a systematic review and meta-analysis. Nutr Rev. 2023;81(12):1501-1524. https://doi.org/10.1093/nutrit/nuad019
- Pearce J, Taylor MA, Langley-Evans SC. Timing of the introduction of complementary feeding and risk of childhood obesity: a systematic review. Int J Obes (Lond). 2013;37(10):1295-1306. https://doi.org/10.1038/ijo.2013.99
- Gingras V, Aris IM, Rifas-Shiman SL, Switkowski KM, Oken E, Hivert MF. Timing of complementary feeding introduction and adiposity throughout childhood. Pediatrics. 2019;144(6):e20191320. https://doi.org/10.1542/peds.2019-1320
- Obbagy JE, English LK, Psota TL, et al. Complementary feeding and micronutrient status: a systematic review. Am J Clin Nutr. 2019;109(Suppl 7):852S-871S. https://doi.org/10.1093/ajcn/nqy266
- Çınar N, Karakaya SO. Tamamlayıcı beslenme. In: Çınar N, Şahin S, editors. Anne ve çocuk sağlığı: ilk 1000 gün. Ankara, Türkiye: Akademisyen Kitabevi; 2018: 275-290.
- World Health Organization (WHO); United Nations Children's Fund (UNICEF). Indicators for assessing infant and young child feeding practices: definitions and measurement methods. 2021. Available at: https://iris.who.int/server/api/core/bitstreams/79267f92-de90-4e1f-a162-4c1042c56929/content (Accessed on Dec 3, 2025).
- Yıldız I, Gölbaşı Z. Determination of breastfeeding behaviors and infant feeding attitudes of mothers with 4-6 months old baby. Turk J Fam Med Prim Care. 2020;14(4):554-563. https://doi.org/10.21763/tjfmpc.744227
- Contento IR. Nutrition Education: Linking Research, Theory, and Practice. 3rd ed. Burlington (MA): Jones & Bartlett Learning; 2016.
- Schwarzer R. Modeling health behavior change: how to predict and modify the adoption and maintenance of health behaviors. Appl Psychol Int Rev. 2008;57(1):1-29. https://doi.org/10.1111/j.1464-0597.2007.00325.x
- Rosenstock IM. Historical origins of the health belief model. Health Education Monographs. 1974;2:328-335. https://doi.org/10.1177/109019817400200403
- Bandura A. Self-efficacy: The exercise of control. New York: W. H. Freeman and Company; 1997.
- Prochaska JO, DiClemente CC. Stages and processes of self-change of smoking: toward an integrative model of change. J Consult Clin Psychol. 1983;51(3):390-395. https://doi.org/10.1037//0022-006x.51.3.390
- DeVellis RF. Scale development: theory and applications. 4th ed. Thousand Oaks (CA): SAGE Publications; 2017.
- Gorsuch RL. Factor analysis. 2nd ed. Hillsdale (NJ): Lawrence Erlbaum Associates; 1983.
- Kyriazos TA. Applied psychometrics: sample size and sample power considerations in factor analysis (EFA, CFA) and SEM in general. Psychology. 2018;9:2207-2230. https://doi.org/10.4236/psych.2018.98126
- Kline RB. Principles and practice of structural equation modeling. 5th ed. New York: Guilford Press; 2023.
- Andrew DP, Pederson PM, McEvoy CD. Research design. In: Research methods and design in sport management. 2nd ed. Champaign (IL): Human Kinetics; 2019: 59-70. https://doi.org/10.5040/9781718221031
- Büyüköztürk Ş. Faktör analizi: Temel kavramlar ve ölçek geliştirmede kullanımı. Kuram ve Uygulamada Eğitim Yönetimi. 2002;32(32):470-483. https://izlik.org/JA38RD36ZC
- Evci N, Aylar F. Use of confirmatory factor analysis in scale development studies. J Soc Sci. 2017;10:389-412. https://doi.org/10.16990/SOBIDER.3386
- Karakoç FY, Dönmez L. Basic principles of scale development. Tıp Eğitimi Dünyası. 2014;13(40):39-49. https://doi.org/10.25282/ted.228738
- Davis LL. Instrument review: Getting the most from a panel of experts. In: Walker HK, Hall WD, Hurst JW, editors. Clinical methods: the history, physical, and laboratory examinations. 3rd ed. Boston (MA): Butterworths; 1990: 194-197. https://doi.org/10.1016/S0897-1897(05)80008-4
- Hu LT, Bentler PM. Cutoff criteria for fit indexes in covariance structure analysis: conventional criteria versus new alternatives. Struct Equ Modeling. 1999;6(1):1-55. https://doi.org/10.1080/10705519909540118
- Hair JF, Babin BJ, Anderson RE, Black WC. Multivariate data analysis. 8th ed. Andover (UK): Cengage Learning; 2019.
- Boateng GO, Neilands TB, Frongillo EA, Melgar-Quiñonez HR, Young SL. Best practices for developing and validating scales for health, social, and behavioral research: a primer. Front Public Health. 2018;6:149. https://doi.org/10.3389/fpubh.2018.00149
- Karaman M. Keşfedici ve doğrulayıcı faktör analizi: kavramsal bir çalışma. Uluslararası İktisadi ve İdari Bilimler Dergisi. 2023;9(1):47-63. https://doi.org/10.29131/uiibd.1279602
- Yalnızoğlu Çaka S, Çınar N. Development of the scale for readiness of pregnant women to hygienic care of the newborn, and its validity and reliability study. Dokuz Eylül Üniversitesi Hemşirelik Fakültesi Elektronik Dergisi. 2020;13(1):10-18.
- Alpar R. Uygulamalı çok değişkenli istatistiksel yöntemler. 2nd ed. Ankara, Türkiye: Nobel Yayıncılık; 2003.
- Gökdemir F, Yılmaz T. Processes of using, modifying, adapting and developing likert type scales. J Nursol. 2023;26(2):148-160. https://doi.org/10.5152/JANHS.2023.22260
- Terwee CB, Bot SDM, de Boer MR, et al. Quality criteria were proposed for measurement properties of health status questionnaires. J Clin Epidemiol. 2007;60(1):34-42. https://doi.org/10.1016/j.jclinepi.2006.03.012
- Walter SD, Eliasziw M, Donner A. Sample size and optimal designs for reliability studies. Stat Med. 1998;17(1):101-110. https://doi.org/dfhrth
- Kartal M, Bardakçı S. SPSS ve AMOS uygulamalı örneklerle güvenirlik ve geçerlik analizi. Ankara, Türkiye: Akademi Kitabevi; 2018.
- Dogan I, Dogan N. An overview evaluation of the content validity used in scale development studies. Turkiye Klinikleri J Biostat. 2019;11(2):143-151. https://doi.org/10.5336/biostatic.2019-65953
- Kline RB. Principles and practice of structural equation modeling. 4th ed. New York (NY): Guilford Press; 2015:1-534.
- Polit DF, Beck CT. The content validity index: are you sure you know what's being reported? Critique and recommendations. Res Nurs Health. 2006;29(5):489-497. https://doi.org/10.1002/nur.20147
- Simon D, Kriston L, Loh A, et al. Confirmatory factor analysis and recommendations for improvement of the Autonomy-Preference-Index (API). Health Expect. 2010;13(3):234-243. https://doi.org/10.1111/j.1369-7625.2009.00584.x
- Celık I, Bektas M. Development and psychometric evaluation of the cardiovascular health behavior scale for children. J Pediatr Nurs. 2020;53:e93-e100. https://doi.org/10.1016/j.pedn.2020.02.038
- Fornell C, Larcker DF. Evaluating structural equation models with unobservable variables and measurement error. J Mark Res. 1981;18(1):39-50. https://doi.org/10.1177/002224378101800104
- Tabachnick BG, Fidell LS. Using multivariate statistics. 6th ed. Boston (MA): Pearson; 2020:612-680.
- Fabrigar LR, Wegener DT, MacCallum RC, Strahan EJ. Evaluating the use of exploratory factor analysis in psychological research. Psychol Methods. 1999;4(3):272-299. https://doi.org/10.1037/1082-989X.4.3.272
- Reise SP, Moore TM, Haviland MG. Bifactor models and rotations: exploring the extent to which multidimensional data yield univocal scale scores. J Pers Assess. 2013;92(5):535-546. https://doi.org/10.1080/00223891.2010.496477
- Van de Vijver FJR, Leung K. Methods and data analysis for cross-cultural research. Thousand Oaks (CA): Sage Publications; 1997.
- He J, van de Vijver FJR. Bias and equivalence in cross-cultural research. Online Read Psychol Cult. 2012;2(2):1-19. https://doi.org/10.9707/2307-0919.1111
Telif hakkı ve lisans
Telif Hakkı © 2026 Yazar(lar). Açık erişimli bu makale, orijinal çalışmaya uygun şekilde atıfta bulunulması koşuluyla, herhangi bir ortamda veya formatta sınırsız kullanım, dağıtım ve çoğaltmaya izin veren Creative Commons Attribution License (CC BY) altında dağıtılmıştır.